Ocean warming now off the charts

Climate Progress

NOAA2014heat_content2000m

The big climate news last week was NOAA and NASA announcing that 2014 was the hottest year on record, breaking the highs of 2005 and 2010. But the bigger story got buried: Global warming has continued unabated in recent years.

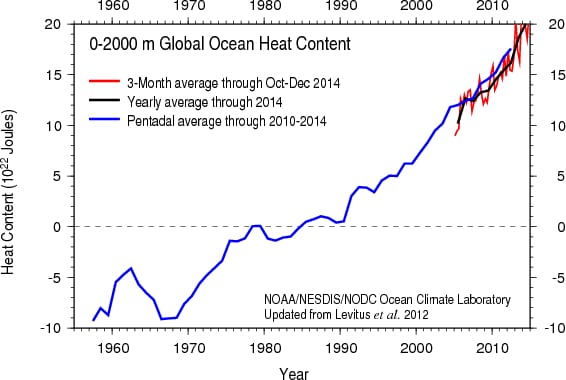
Indeed, it’s not just that there not been a hiatus or pause or even slowdown in surface temperature warming (see below). The oceans, where the vast majority of human-caused global warming heat goes, have seen an acceleration in warming in recent years. As climate expert Prof. John Abraham writes in the UK Guardian, “The oceans are warming so fast, they keep breaking scientists’ charts.”

WhereGWisgoing1Remember, more than 90 percent of human induced planetary warming goes into the oceans, while only 2 percent goes into the atmosphere, so small changes in ocean uptake can have huge impact on surface temperatures. That’s a key reason surface temperatures haven’t appeared to warm as fast as many had expected in the past ten years — although ocean warming has sped up, and sea level rise has accelerated more than we thought , and Arctic sea ice has melted much faster than the models expected, as have the great ice sheets in Greenland and Antarctica

But here’s where the media’s sometimes single-minded focus on one statistic — the hottest year on record — misses the real story from the latest scientific data and analysis. The human-caused rise in surface air temperatures never paused, never even slowed significantly. And that means we are likely headed toward a period of rapid surface temperature warming. Here’s why.

Dr. Gavin Schmidt, director of NASA’s Goddard Institute of Space Studies, tweeted last week “Is there evidence that there is a significant change of trend from 1998? (Spoiler: No.)” He attached this chart, which uses NASA’s latest data:

NASAwarmingTrend-638x478
The latest NASA temperature data make clear that not only has there been no “pause” in surface temperature warming in the past decade and a half, there hasn’t even been a significant change in trend.


If the media can finally stop missing the forest for the trees, if they can stop missing the blatantly obvious warming trend everywhere scientists said we would see it because they only stare at a very narrow set of (generally misinterpreted) data, then they should stop repeating the myth of a hiatus or even of a global warming slowdown once and for all.

In fact, the next big story may well be that surface warming starts accelerating soon. As the lead author of one 2014 study said:

“Scientists have long suspected that extra ocean heat uptake has slowed the rise of global average temperatures, but the mechanism behind the hiatus remained unclear…. But the heat uptake is by no means permanent: when the trade wind strength returns to normal –- as it inevitably will –- our research suggests heat will quickly accumulate in the atmosphere. So global [surface] temperatures look set to rise rapidly….”

And that, combined with the current record ocean temperatures — and faster than expected warming of the ocean’s surface layer — means we can expect a continuation of the unexpectedly fast loss of Arctic sea ice and of land-locked ice in Greenland and Antarctica. And we should anticipate even more record-smashing extreme weather than we’ve had in recent years, as we throw more fuel into the an already supercharged atmosphere.


Source: Climate Progress. Reproduced with permission.

Comments

8 responses to “Ocean warming now off the charts”

  1. Rob Avatar
    Rob

    I’d like to show the heat content chart to someone who denies ocean warming. I predict however that he will dismiss it saying that ocean heat content prior to 1980 wasn’t negative and in so doing feel he will have completely dismantled the entire IPCC position.

    I expect there will be some rationale and reference point that explains the horizontal “zero heat” line on the graph. Are you able to shed any light on this that explains the “zero heat” reference point being used in the first chart?

    1. Geoff James Avatar
      Geoff James

      Hi Rob, I’m not an oceanographer but I consulted the original paper at ftp://www.lib.noaa.gov/pub/woa/PUBLICATIONS/grlheat12.pdf and there it says (p1) “Ocean Heat Content is always computed with a reference mean subtracted out from each temperature observation. Otherwise the OHC computation depends on the temperature scale used.” Then (p2) “the same objective analysis procedure used by Locarnini et al. [2010] is applied to these gridded, composited anomaly values and a global, gridded field with temperature anomaly values defined in every one-degree square is produced for each standard depth level. To compute heat content at each gridpoint the specific heat and density were computed using annual climatological values of temperature and salinity from Locarnini et al. [2010] and Antonov et al. [2010].” So the short answer is, the calculations aren’t easy, and they produce heat content on a relative scale. Geoff.

      1. Rob Avatar
        Rob

        Thanks Geoff, much appreciated!

  2. Jason Avatar
    Jason

    So we are in the time that is like when you put pasta on to boil, the gas is on and the water isn’t boiling yet, but it is heating, but as soon as it reaches the critical threshold, you see the water churning and boiling …also when you turn the gas off the water retains the heat and since co2 stays in the atmosphere for approx. 100 years the gas is going to on for some time to come!
    the magnitude of the energy being absorbed into the oceans is mind boggling… if we push this system over the edge and we unleash this energy and it drives a whole new climate pattern, well we might survive we might not…. given how inflexible we are showing ourselves to be I suspect we won’t adapt …

  3. Mikey Avatar
    Mikey

    Alarmist BS again. It is not off chart, the chart scale is wrong. The heat capacity of the ocean is in the order of 1,27 x 10^25 J. The added heat is +/- 0,7%. This means 0,09 degrees on an average temp of 12 degrees Celsius in the mentioned layer. This 0,09 degree is not melting the ice sheets faster…

    1. john Avatar
      john

      You are so correct Mike
      The earth is cooling.
      Actually we should be however can you just post your information that shows and supports your statement ” Alarmist BS again ”
      Because we are now moving into a lessening effect of energy to the earth with the Milokavitch cycle we should have no problem with any effect from man correct.,
      No more energy is being absorbed by earth due to its orbit and angle etc.
      so perhaps Mikey you can tell us just what is the story.

      1. Mikey Avatar
        Mikey

        Hi John, (Alarmist I presume?)

        I did not say the earth is not warming. The question just is how much the earth is warming and more specific how much it will warm in the future. How the climate responds to the different variables, man induced and not man induced, is unknown. All of the models are wrong in predicting the current situation. Although alarmists are saying there is 97% consensus, this is untrue as most is that is twittered and talked about in the media by left wing green folk about climate change.

        To show graphs that are off the chart is the famous Hockeystick all over again. The ocean did warm 0,09 degrees in the period from 2003. So what do you want “normal people” to beleive if they see this (propaganidic) chart. 0,09 degrees what are we talking about….
        OH BUT WAIT….PANIC!!! PANIC!!! Let’s build windmills. They will save us! …. And use our money to subsidise them in stead of using iour money to adapt to the climate change where needed and invest in techniques that will really help save our resources.

        1. john Avatar
          john

          Hi mike
          it is the rate of change that is the real story.
          As to the Hockeystick this has been covered reviewed and approved.
          No amount of saying it is not true will change the facts.
          good luck in your endeavours.

Get up to 3 quotes from pre-vetted solar (and battery) installers.