Know your NEM: Time to focus on ISP, and dump the NEG

Figure 12: Baseload futures financial year time weighted average

What’s interesting this week:

  • AEMO’s Integrated System Plan [ISP]
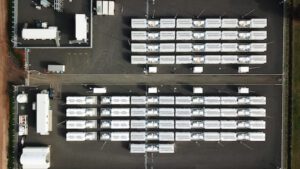
  • Distributed Energy Resources [DER] development

These two topics cover one of the main debates, one that many don’t even see as a debate – namely: Are grid delivered and behind the meter electricity in competition, or in Co-Opetition ?

Every kilowatt hour (KWh( of behind the meter investment is a KWh that won’t be delivered by the grid. Every KWh of household battery is a KWh taken away from peak pricing available to grid suppliers.

At the same time it’s laughable to suggest that a developed economy can or should be entirely or even largely behind the meter.

What is a microgrid? Where are its boundaries? At a recent DER forum attended by many knowledgeable people it was clear to me that DER is a technology and software rich market that is offering tremendous opportunity for some business.

I must have spoken to two or three company owners that have seen employee numbers go from 15-30 and from 30-60 in 12-18 months.

The scale of the problems being tackled is increasing. It’s not just a household PV and a battery but keeping medium size businesses with mission critical power supplies running, sometimes at the end of long grid lines.

Cities and towns are starting to think what they can do to progress their electricity ecosystems and, as electric vehicle penetration grows, this will become more of an issue.

We still think town councils and city mayors could do more to speed EV uptake than just about anyone through parking concessions.

Property developers, and aren’t there a lot of them, can and do think about “the grid” of a new property development, although they may not think of it as a grid.

It wasn’t defined at the forum, but I tend to think of a micro-grid as an electricity consumption point or connected set of points that can be islanded from the main grid for a period of time. It’s not the size but the self sufficiency element that matters.

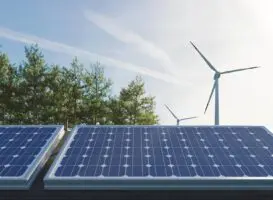
We can contrast the thriving DER market with the paralysis that has gripped the in-front-of-the-meter “main grid” in recent years. Yes, over 4GW of new renewables investment is underway, but the broad design of the system they fit into remains, frankly, unresolved.

Snowy 2.0 is at odds with the NEG

Snowy 2.o is a clear example. It’s been obvious from the start it only makes any kind of sense in a high renewables world, even if its economics still depend on selling caps as much as energy.

So we have the federal government investing $10 billion and $2 billion of transmission in a high renewables future, but still putting in place a low renewables future NEG.

How can you run an industry policy that way? How can you win an election when you won’t trust the people to tell them what you really think?

The same could be said of Shorten and Adani. Prime ministers are in a relationship with voters, whether they realise it or not. Relationships depend on some degree of trust. Actions speak louder than words.

In any event, getting back to the ISP, Here is a reminder from AEMO’s website of what it is, and what it is supposed to achieve:

“AEMO is calling this an Integrated System Plan (ISP), rather than an integrated grid plan, to reflect that over time, the ISP will by necessity consider a wide spectrum of interconnected infrastructure and energy developments including transmission, generation, gas pipelines, and distributed energy resources.

The June 2018 ISP is not the end of the process, but rather the first of many steps, with updates in future years to reflect the dynamically changing nature of the power system and the need to continually innovate and evolve strategies for the future.

The first ISP in June 2018 will deliver a strategic infrastructure development plan, based on sound engineering and economics, which can facilitate an orderly energy system transition under a range of scenarios. This ISP will particularly consider:

  • What makes a successful renewable energy zone (REZ) and, if REZs are identified, how to develop them.

  • Transmission development options.”

Comments on this plan are now closed at the AEMO site but we continue to enthusiastically wait for news including, hopefully, publication of comments and submissions.

In our view the ISP and not the NEG is the plan COAG should focus on. If COAG gets behind the ISP Australia may yet manage the transition to a low carbon economy in a way that we can be proud of.

Design of the NEG, or in any event policies for reliability and carbon emissions, in our opinion logically comes after the ISP is agreed – and not before. It’s amazing to me that the ESB doesn’t even seem to know about the ISP. Same with AEMC. Come on guys, where’s the love?

Clearly one part of the plan will be thinking about DER’s fit with the grid in a more systematic manner. DER is very disruptive and its getting bigger not smaller.

The weekly numbers

Electricity volumes for the past seven days at 3.6/TWh were 3 per cent lower than PCP driven down by rain and weather in Queensland, where consumption was down 8 per cent. I suspect that the annualised seven-day total is pretty much the lowest on record for this week in the year.

This had a knock-on impact on spot prices which averaged as low as $63/MWh in NSW, pretty much half last year in a region where consumption was flat. As interesting as the highs are the lows. In Victoria, a low price of $14/MWh was seen and I don’t recall seeing that often since Hazelwood closed.

Futures prices continued to drift, although if we use 2019 as the baseline, they have been pretty flat for months. FY 20 futures in Queensland are just $63/MWh, probably less than in China but remain at $80 in Victoria.

However at some point, not for a few years, but at some point, the Gladstone power station is going to close and Queensland’s own Hazelwood moment will arrive.

In general, Summer has in the end been a non-event for the electricity market. Despite odd days of heat, and a few occasions where pool prices threatened to go through the ceiling, it didn’t happen.

This is a credit to all concerned, but having been the first to hand out the booby prize to AEMO in regard to managing South Australia’s blackout we are happy to hand them a bouquet for managing this Summer across the NEM.

Gas prices, REC prices were of little interest. REC prices post 2020 remain a puzzle as does how projects developed under a NEG framework will be treated from an REC point of view.

Just another pesky detail, one of very many to keep NEG apparatchiks tied to the desk.

Figure 3: Summary

Coal prices fell during the week, otherwise no major international action.

Figure 4: Commodity prices. Source: Factset

Share Prices

Share prices drifted. Lithium shares remain on the nose. There are repeated stories that the “lithium bubble” is going to burst or has burst. That may be the case and eventually will be true. However for the time being our optimism on demand growth is greater than our pessimism on supply growth.

Figure 5 Selected utility share prices
Figure 5: Selected utility share prices


Figure 6: Weekly and monthly share price performance

Volumes

Figure 7: electricity volumes

Base Load Futures, $MWH


Figure 12: Baseload futures financial year time weighted average

Gas Prices

Figure 13: STTM gas prices


Figure 14 30 day moving average of Adelaide, Brisbane, Sydney STTM price. Source: AEMO


David Leitch is principal of ITK. He was formerly a Utility Analyst for leading investment banks over the past 30 years. The views expressed are his own. Please note our new section, Energy Markets, which will include analysis from Leitch on the energy markets and broader energy issues. And also note our live generation widget, and the APVI solar contribution.


David Leitch is a regular contributor to Renew Economy and co-host of the weekly Energy Insiders Podcast. He is principal at ITK, specialising in analysis of electricity, gas and decarbonisation drawn from 33 years experience in stockbroking research & analysis for UBS, JPMorgan and predecessor firms.

Comments

12 responses to “Know your NEM: Time to focus on ISP, and dump the NEG”

  1. Malcolm M Avatar
    Malcolm M

    Three other significant announcements from Australia’s mining industry:
    1. A new iron ore mine near Broken Hill with an average new load of 87.4 MW
    http://www.carpentariares.com.au/project/default/view/hawsons-iron-project
    Will this mean more solar development in the Broken Hill area ? The price received for generation in Broken Hill is 20% higher than the NSW pool price because of line losses, and the area has solar resources better than almost anywhere else on the NSW grid. One of the few downsides is limited transmission capacity (~200 MW) to the rest of the NSW grid should mining demand reduce because of a mine closure.

    2. Oz Minerals new Carapateena mine in SA to be connected to the grid, presumably for flotation of its copper-gold resource, so perhaps an extra 50 MW of SA demand.

    3. BHP Olympic Dam giving notice to OZ Minerals that it will no longer be able to access the 275 kV Olympic Dam line after 30 August to supply the Prominant Hill mine. This may mean that BHP are expecting to increase their power demand at Olympic Dam, so more total demand in SA.

    1. David Osmond Avatar
      David Osmond

      The 200 MW Silverton wind farm is currently under construction and is about 25km from Broken Hill

    2. David leitch Avatar
      David leitch

      Thanks Malcolm. All that is noted.

  2. Peter F Avatar
    Peter F

    David you are almost spot on re the ISP vs the NEG, however even that is still focused on low cost large scale wind and solar well away from the load.

    With strong energy efficiency and high efficiency solar, probably something in the order of 60-70% of premises can be net zero With good building practice and high efficiency appliances most freestanding houses can get by with 12-25 kWh per day including cooking, hot water, heating and cooling. With 8-12 kW solar becoming common they will be generating 50% more than they use. Sporting facilities etc can probably generate 3 times their load

    NREL says that 14% of the roofs in the US can supply peak demand and 30% of total demand with 16% efficient solar. Australia probably has more unshaded roof per capita and certainly better average insolation than most of the population centres of the US. We also have lower electricity demand so it is likely with say 20 % of roofs covered with 20% efficient solar panels we can easily supply peak demand and could theoretically supply more than 50% of total demand. if we put solar canopies over hard surfaces like car parks and railway platforms as well as roofs

    Germany with old fashioned wind and solar generates 670 MWh per square km including cities, towns, lakes and forests.. Given higher wind speeds, higher radiation and more open country with newer technology that should translate to about 2,000-2,500 MWh here. If we build wind solar, micro hydro and biomass waste to energy in the near city regions we can generate all the power we need within 150-180 km of the population centres.

    That rule also means that remote centres like Bourke, and even high demand areas like Roxby Downs, Broken Hill, Mildura and Mt Isa can be locally powered without large losses or expensive, high capacity HV grids

    1. David leitch Avatar
      David leitch

      Peter

      There is little doubt about what is technically possible. However the question of what is the most economic solution for the entire economy is still very much in the melting pot.

      1. Peter F Avatar
        Peter F

        That is very true but we are certainly giving the local distributed energy a red hot go on the solar front. Now we need to follow the European example and build town and village owned wind farms with 3-10 turbines, and 500-10,000 kW solar farms connected direct to the 11-66 kV distribution grids. 200 more Daylesfords

    2. Rick Avatar
      Rick

      Solar and wind resources are dispersed. There is negligible benefit of scale with solar and only small benefit of scale with wind. This means any grid scale wind or solar generation is severely hobbled by the cost of transmission, distribution and retailing.

      We already see how this pans out in SA with the most economic solution now local solar and battery going off grid. The SA grid is dead economically. All recent assets purchases have come from general revenue because the remaining consumers could not bear the cost. And don’t forget that SA has huge reliance on Vic to source and sink its dips and excesses from variable wind power as well as massive transfer payments from consumers in other states for the excess LGCs produced in SA. If South Australians bore the total cost of their network alone it would be horrendous. Capacity factors of the SA wind generators would be much lower because they would be constantly constrained. In fact none of them could produce through the middle of a sunny day in September even if the wind was blowing. They desperately need the link to NSW so they can cause the same disastrous disruption there as they have created for Victoria with the 600MW Vic link.

      1. Peter F Avatar
        Peter F

        Because solar and wind are dispersed they can be located near the load thus T&D losses and investment can be reduced. The proposed pumped storage projects in SA offer real additional peak capacity. Interconnectors will only help if the SA peak is significantly out of synch with peak Eastern state demand as both NSW and Victoria are already importing at peak load so haven’t got any more to spare for SA.
        Based on recent work done by Deloittes for the Netherlands, SA could generate at least 90% of its power from rooftop solar and there are almost zero transmission losses. Building out a series of meshed micro-grids backed up with biomass/waste to energy and wind means that SA will need about half a peak days storage to be able to eliminate imports altogether

        1. Rick Avatar
          Rick

          Agreed, having a grid does not make sense if the source of generation is wind and solar. Grids in Australia (and many other countries) were developed to transport power from centralised generators located near coal mines to load centres; notably the cities.

          The problem is that wind and solar energy are expensive for energy intensive industry compared with coal generation so all the heavy industry becomes uneconomic and leaves.

          Insidiously, the true cost of wind and solar energy is loss of all heavy industry and the jobs that go with it. This is already apparent in Australia.

          AEMO forecast that the minimum demand in SA will be zero by September 2024. That means all the current grid scale wind and solar will have zero demand at these times. The link to Victoria will be strapped just taking the output from the gas plant needed to keep the SA network stable. The consequence is that the capacity factors of the grid scale wind and solar become increasingly constrained as the wind and solar market share increases. So all the money being spent on grid assets has reduced opportunity to provide an economic return.

          1. Peter F Avatar
            Peter F

            Wind and solar were expensive. Australia is running at about 18% renewables, Germany 40% China 26%. Germany and China and Spain and Italy all have higher wind and solar share than us and much higher industrialisation so the loss of heavy industry is not driven by wind and solar penetration.
            New wind and solar in Australia are about 35% cheaper than the latest bids for wind and solar in Germany and we need less storage because
            a) our peak demand is on sunny windy afternoons. Theirs is on dark still winter nights.
            b) our hydro capacity is equal to almost 25% of peak demand theirs is 6.3% of peak generation
            c) our grid is more widely dispersed and minimum wind speeds are higher and modern wind turbines generate much more power at low wind speeds so minimum wind and solar can be a much higher proportion of both peak and minimum demand

            SA can build local storage for far less than the cost of an interconnector to the Sydney basin and combined with synthetic inertia from the wind turbines will provide much more stability than another interconnector at less cost

          2. Rick Avatar
            Rick

            Your figures need to be carefully qualified. Wind and solar in Germany achieves 14%. The other non-fossil are hydro and biomass. In China wind and solar achieve less than 4%. The vast majority of non-fossil in China is hydro. Likewise the majority of Australia’s non-fossil is from hydro.

            Hydro is dispatchable and quite different to the intermittency of wind and solar.

            I operate about 50% of my house loads on off-grid solar to maximise my income from the FIT. I know how much overbuild and storage is required to meet a specific demand. Very few people have any understanding of the need for overbuild and, indeed, the amount.

            This linked paper gives good insight into the issues that intermittent generators face to produce power for a given demand:
            http://www.hanswernersinn.de/dcs/2017%20Buffering%20Volatility%20EER%2099%202017.pdf
            It covers the German network and identifies the challenges they face. Take the time to read it and absorb the information. You will realise why Germany is gradually losing its heavy industry.

Get up to 3 quotes from pre-vetted solar (and battery) installers.