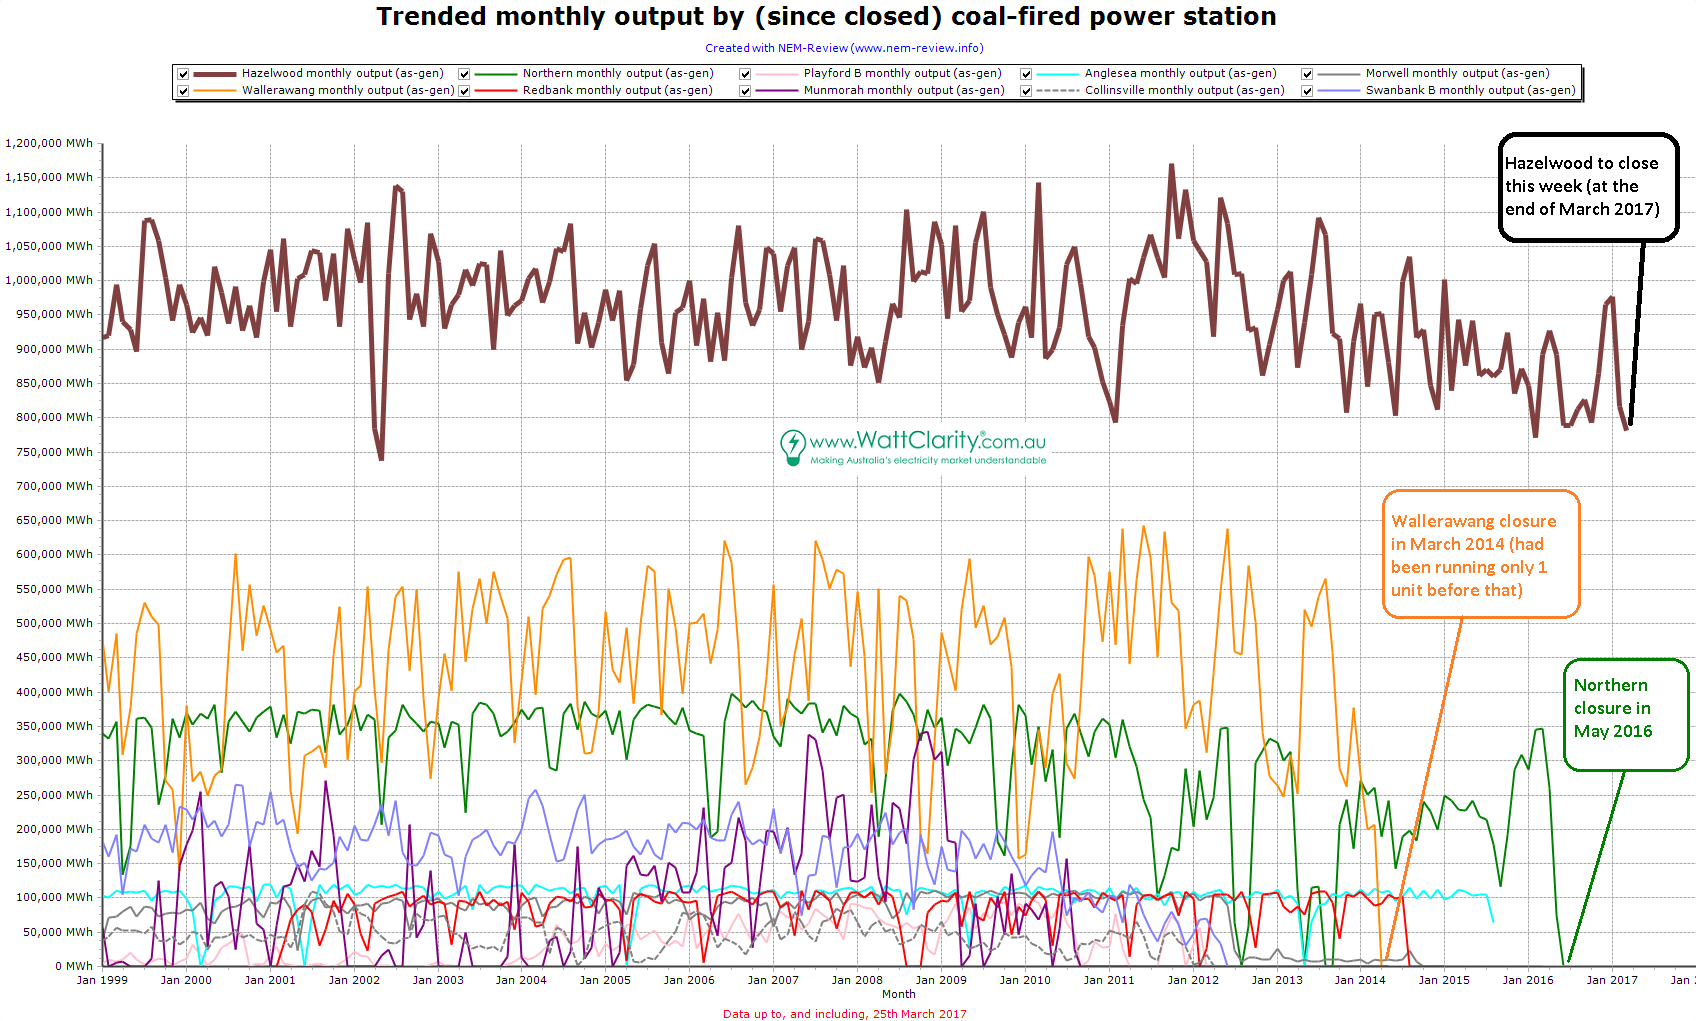
Summary – policy thought bubbles are no substitute for energy security
Today marks the start of the winddown of Hazelwood, an important event for sure. New supply is coming in the form of 4Gw of renewables but Hazelwood is not the only thermal supply issue and demand is also likely to grow a touch. Meanwhile we have no management of the NEM. Federal Govt policy appears to be based around thought bubbles of new power stations in North Queensland or Snowy 2.0. These are five years away at best even if they were not completely out of touch with electricity industry recommendations and thinking (in the case of North Qld coal). An ACCC enquiry into retailing is no substitute for the growing oligopoly in thermal supply. The time to act on this was when AGL was buying Macgen. Today its yet another case of missed opportunities.
The only new supply capable of helping over the next two years is either finding more gas to run some peakers and combined stations harder, or backing renewables.
Extra incentives could be added to both household storage and distributed PV. This could achieve results in 12 months. New wind farms and new PV can be built in 18 months. ORG’s Stockyard Hill could add 500 MW of wind in Victoria if someone would just press the button.
Turning to the weekly action
- Volumes were up 6% over PCP driven by temperatures that were 4C higher than last year in both Sydney and Melbourne. Our summary table now includes average 7 day temperatures for the three major demand drivers and the change on the previous year. Volumes were higher than last year in Victoria even as Hazelwood starts to be shut down. For the sake of interest the attached chart is from Nem-Watch and shows generation by fuel across the NEM as of 11:00 AM Monday morning. High volumes of wind in SA mean that electricity flows from South Australia to Victoria for once. Despite that spot prices are over $100 MWh in Vic at the time of writing.

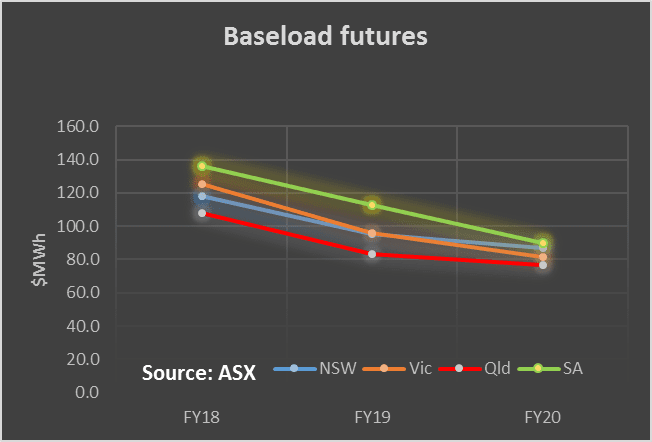
- Future prices rose but the action seems to be moving from FY18 to FY19. FY19 prices are $95 MWh in NSW and Vic and $83 in Qld up 4% on the week in NSW and 6% in Victoria. These prices will continue to provide a signal to new investors. Still the risk to investors remains very much around policy uncertainty. Even a new PV or wind farm reaching FID today won’t be operating before the end of 2019 and so its average revenue in the 2019-2039 period that matters. A reverse auction could guarantee that revenue to a new project in a way that an emissions intensity scheme or LRET target cannot. We will have more to say about this.
- Spot electricity prices. Were 45% up on PCP NEM wide but up over 100% outside of QLD. Once again weather is the likely factor. We’d like to know how fast Portland smelter output is increasing and its impact on demand but info is scarce.
- REC Unchanged. Of the 4GW of new supply coming online a significant portion (rootop PV and about 500 MW of wind) won’t be used for LRET surrender. Prices could thus be expected to stay high. That said the scheme is completely hopeless as a way to procure renewable energy in a systematic fashion.
- Gas prices Remain high but drifted down towards $10 GJ. Gas demand for electricity generation remains strong in QLD and in Victoria.
- Utility share prices. One negative feature of capital markets is the ongoing rise of US interest rates. Utilities by an large are yield oriented and renewable energy is driven by the cost of capital as much as it is by technology cost reduction. One reason why US wind farms have unsubsidized LCOE of US$40 MWh = A$53 MWh is the cost of capital.

Despite that AGL is unsurprisingly up 10% on the month and 43% on last year. Ausnet announced that due to tax benefits it could increase its dividend this year by 1 cent but at the expense of dividend franking. Because this is a one off it might not influence the share price much. The ASX 200 is up 2% for the calendar year and a pleasing 15% on PCP.

Share Prices


Volumes

Base Load Futures


Gas Prices


David Leitch is principal of ITK. He was formerly a Utility Analyst for leading investment banks over the past 30 years. The views expressed are his own. Please note our new section, Energy Markets, which will include analysis from Leitch on the energy markets and broader energy issues. And also note our live generation widget, and the APVI solar contribution.


