- Volumes in the week ended October 21 were flat across the NEM with Victoria and QLD up for the week, as compared to the previous corresponding period, and NSW, SA & TAS all down. Volumes are showing no real trend growth other than in QLD and overall volumes remain in the seasonally week Spring phase.
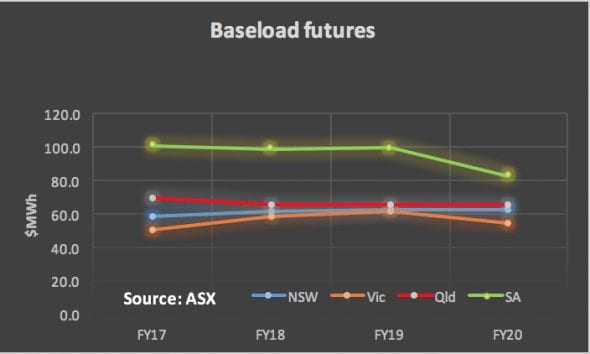
- Future prices:. Were mostly up a touch with NSW and VIC FY18 up about 2%. QLD FY20 futures jumped 8.8% but this is largely just a theoretical movement.
- Spot electricity prices.. remained well above last year’s levels, other than Victoria. There was reasonable price volatility with a maximum price in South Australia of $2,474 and a minimum price also in South Australia of minus $196 MWh
- REC. prices were unchanged and we don’t see much change ahead. Prices for the next couple of years are more or less locked in by physical supply and demand. Unless rooftop solar installations switch from SREC to LREC the supply of LRECs for the next two years is reasonably foreseeable and demand is fixed. As we have explained at length this basically is a cost every consumer has to pay as a result of delayed investment.
- Gas prices. Are about 50%-70% higher than last year although interestingly the Qld spot price is below that of NSW and South Australia. Scheduled shut downs of the various QLD LNG trains that occur during the commissioning phase (12-18 months) will lead to large changes in gas supply in Qld which get reflected in the STTM price.
- Utility share prices: Plenty of weekly price action at the smaller end of the market but the most interesting change at the large end is the 10% fall in the APA price over the past month. This likely reflects both the market’s general reaction to worries about interest rates and also specific concerns that increased regulation may hurt APA’s cash flows in the future. We will be talking to APA CEO in one of our podcasts to hear Mick McCormack’s views on a range of topics.
- Listed company news. The main releases this week for us were a presenatation by Genex that demonstrated the seemingly attractive economics of their single axis tracking PV plant at Kidston (AC capacity factor of 33%. The only disadvantage of this plant is its relatively remote loacation. The company’s “big project” of 250-450 MW of pumped storage is aiming for financial close in the December half of 2017. One of the hurdles is that it will require transmission support.

Share Prices


Volumes

Base Load Futures


Gas Prices

David Leitch is principal of ITK. He was formerly a Utility Analyst for leading investment banks over the past 30 years. The views expressed are his own. Please note our new section, Energy Markets, which will include analysis from Leitch on the energy markets and broader energy issues. And also note our live generation widget, and the APVI solar contribution.


