After much anticipation, this week the Coalition finally released their 2030 emission targets that they will be taking to the Paris climate negotiations at the end of the year.
The shifting of baselines from 2000 levels to 2005 – widely regarded as a trick to make their targets appear stronger than they are – can make it somewhat confusing to understand and compare 2030 targets offered by the major parties.
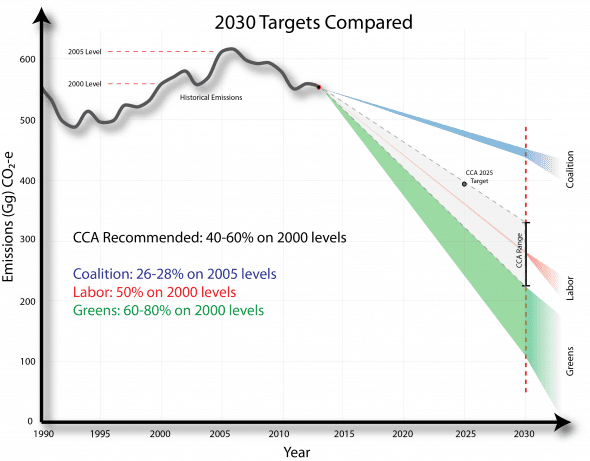
Because of this, and being somewhat of visual person, I decided to chart the differences, along with the recent recommendations from the Climate Change Authority (CCA), the Government agency created specifically to make independent recommendations on climate targets.

As you would expect, the Greens have the most ambitious target, followed by Labor and then the Coalition. Interestingly, Labor’s 2030 target (driven internally by the influential Labor Environmental Action Network’s ‘50/50’ campaign) is right in the middle of the CCA’s recommended range. This could indicate that Labor is laying the groundwork to align itself with the independent body.
As to whether these targets are consistent with a 2°C goal is a harder question to answer, mainly because the effort is shared internationally (the Coalition’s targets certainly put us close to the back of the pack though). My interpretation is the Greens target are the most aligned with the science, while the CCA/Labor targets are more politically palatable, but still in the ballpark to get us there. The Coalition target, as it stands, will lock in failure.
While the targets themselves are important, what’s currently missing is more detail from all the major parties about what concrete policy mechanisms will be used to reach them beyond high-level statements about Carbon Trading/Emissions Reduction Fund etc.
This is important because even if we were to switch to a 100% clean electricity grid overnight, we’d still only be around half of the way to true decarbonisation, thanks mostly to our agricultural, transportation and fugitive emissions.
Perhaps even more important, though, is the amount of domestic carbon “lock-in” the proposed policies will create. A high lock-in factor would reduce our flexibility in responding to new scientific evidence or if we had, say, a change in our approach to the way we evaluated the risks that dangerous climate change poses.
A bad set of policies could potentially make it unfeasibly expensive for Australia to increase ambition dramatically should the need arise.
Steve O’Connor is a climate leader for Al Gore’s Climate Reality Project and is also communications advisor for SolarShare