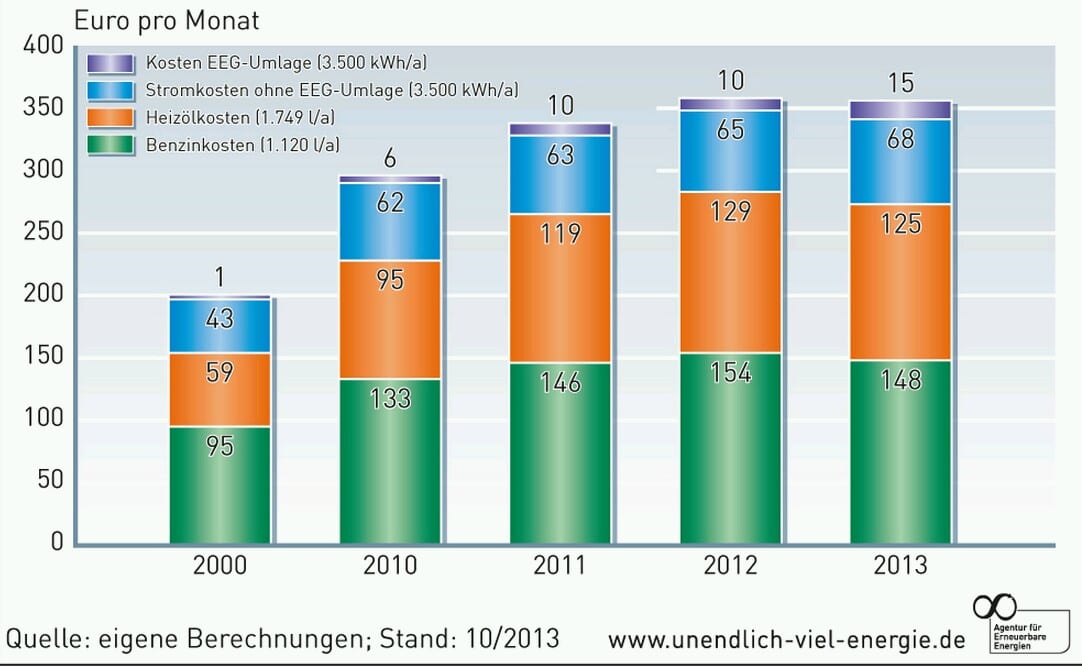
This interesting and beautiful graph was recently published by the German Renewable Energy Agency (Agentur für Erneuerbare Energien). It shows the increases of energy costs per month for the average German household from 2000 on. The tiny, small, barely visible violet part at the top is the cost of the feed-in tariff surcharge.

We see an increase in surcharge costs of EUR 14 per month from 2000 to 2013. But at the same time, other costs of electricity increased even more (by EUR 25 a month).
And the cost of heating oil increased by EUR 66, the cost of gasoline by EUR 53 a month. In comparison, the cost of the surcharges is rather small.
In total, energy costs increased from EUR 198 a month to EUR 356, or by EUR 158. The surcharge costs are less than ten percent of that.
Most of the cost increases come from the fact that the oil price has gone up by a factor of five in that decade. I expect more of the same in the future.
That of course means that in the long term it is much cheaper to have a fast transition to renewable than a slow one, even if the costs of the present speed were substantial, which they are not.
This article was originally published on Lenz Blog. Reproduced here with permission
– See more at: http://k.lenz.name/LB/?p=10013#sthash.HODGzRDI.dpuf