There are two great things that come from taking a long break each year.
First, you get to connect back with life a bit; family, friends and just doing stuff you want to do. Secondly, it gives you a chance to extricate yourself from the grind of getting work done to philosophising about what you are doing and how to do it better.
For me at least, this is when the issues around solar and energy start to crystallise and arrange themselves better. Stimulated by a number of conversations and new data, I can now see through my PV coloured glasses that a revolution is underway.
I think this year is going to be incredibly fascinating for solar and energy and here’s why.
Forecasts and penetration
Each year I start out with a little geek-fest with my old friend Warwick Johnston from Sunwiz. This year will be the third consecutive year that we have sat down and analysed where we think the local solar market will go; and based on last year’s results, we are producing ever more accurate forecasts.
We start out by analysing detailed data on component and system costs across a variety of sizes and markets and calculate a complex set of financial outcomes for each State. With this fundamental economic proposition, we then take into account electricity prices, inflation, exchange rates, incentives (if any) and so on. Then we look back at historical uptake, compare market reactions under different circumstances, take into account the market stimulants and produce a business as usual forecast. By progressively taking into account a wide variety of factors that could positively influence take up rates, we then produce accelerated forecasts.
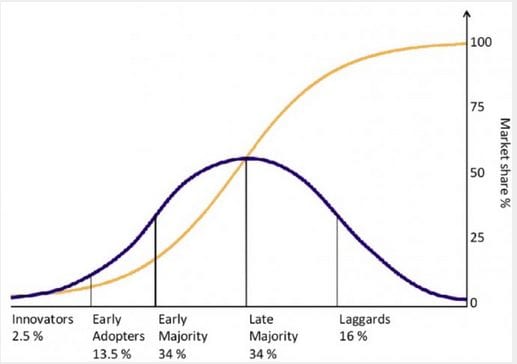
The most exciting part of the exercise this year was when we took something new into account which had previously not had such a strong influence; the effect of changing household penetration rates and the increasing interrelationship between them and technological evolution. Penetration rates and their impacts can be assessed in many ways (e.g. available rooftops, grid penetration levels, general consumer penetration etc.) and whether the generic guides to flattening demand apply in the Australian PV market remains to be seen. However, the following graph describes the conventional wisdom about how markets react to technology uptake. Clearly, we are well and truly in the early majority phase of penetration.

With this in mind we added a whole new dimension to our forecasts; both positive and negative and some absolutely fascinating likely trends emerged. Just a few examples include things like:
- Some States are likely to hit very high uptake penetration rates very soon. This will soften demand in some places and is likely to swing attention to others.
- Potential flow-on effects from this include changes in the value of solar companies depending on positioning, changes to the likely conversion rates on marketing and sales and the need for enhanced innovation to get sales in new niches, in certain markets.
- We also saw an emerging likelihood of some State based schemes coming under changing pressure levels which will undoubtedly influence political reaction and policy.
To get the real detail on what we see happening (and who wouldn’t want that!?) email us here for a pre-launch special offer on our report “Australia PV – Market Forecast 2012-2017”.
Solar products
Whilst we looked very hard at the likely trends in global PV in our forecast, the International PV manufacturing sector was something we paid particular attention to. As a large market (an estimated 1GW in 2012 alone), we are intrinsically connected to what happens in other key markets and the entire supply and demand chain.
China’s incredible importance in the supply chain and the implications of a 35GW global market demand in 2013 with an estimated 60GW of global capacity should not be considered lightly. Recent reports of many PV factories running at 50% capacity utilisation does not bode well for many companies survival, and yet, the sectors importance purely in employment terms is so important, decisions about economic viability are viewed in an entirely different context by the mighty Dragon.
A shake up is inevitable, but share prices and profit forecasts are improving from some of the world’s PV companies so just where the impacts are going to be felt remains unclear.What is clear is that choosing suppliers who are more likely to survive than not, is increasingly crucial.
But of course, the PV and Inverter manufacturing sectors are awash with claims of superiority, strength and experience so how do you pick the right partners? That is subject of our all new report being released in the coming months titled “Australian PV – Technology and Brands report 2013”.
In this report, an Australian first, we will provide analysis, data and insight into just who these leading companies are in an Australian context, including a much sought after Australian volume and tier ranking for the very first time. And just who is Australia’s most popular PV brand?……..
Storage and energy management
The other fascinating revelation we had was that between now and the end of our forecast period (2017), a significant increase in the uptake of storage and energy management devices has become inevitable.
Talking with a number of companies and reading the latest reports from around the world in recent weeks have revealed how rapidly this technology is evolving and we expect this part of the revolution will become increasingly obvious this year. We also found we some fascinating niches where uptake is likely to accelerate sooner and some places where it will take longer. Once again, working through our various scenarios, the rate and timing of growth varies but what is absolutely clear is that it has started.
The storage medium is of course critical and although the favoured LiPo4 still has a little way to go until it is truly cost effective and proven, some really big things are happening in both the cost and innovative deployment techniques. If it’s not 2013, it will be very shortly afterwards when new types of storage are economic and the box they are housed in just may look surprisingly like a car or a motorcycle, adding a whole new dimension of versatility and economic rationale.
Intrinsically connected and equally important however is the energy management system that allows this to seamlessly and practically work together. A number of companies are working on brilliant products that will hit the market in 2013, building on a small existing range; watch out for competition breeding innovation. Revolutionary energy management and control is virtually at our fingertips and it is clear to me that in 2013 we will see a convergence of products and features like never before.
Measurement, data and mobiles
The devil being in the detail, we also found our-selves compelled to consider and research a number of issues surrounding data collection, management and access when we looked at the various market applications and niches.
Some interesting facts and scenarios emerged. Firstly, it’s worth noting some statistics around smart devices. In 2012 around five hundred million smart phones were sold. Apple alone (who only hold around 20% market share), sold forty seven million iPhones in the last quarter of 2012 and nearly twenty three million more iPads. Depending on which country you are in around 15-55% of mobile subscribers now use smart phones (around one billion globally) and with only 14% penetration into the global mobile market, growth has only just started. And another billion or so are using tablets, laptops and desktops; make no mistake, we are connected and growing.
No matter which smart device it is, the relevance to our industry is the data capture, processing and display capability of these devices. Personally, I never want to buy another display/screen/controller for any device in my home; I have enough!. I have one (my smart phone) that I’ll inevitably upgrade in a year or so to the latest version, so just give me access, an app, streaming data and I’ll take control of everything from a single device, thank you very much. Converge me!
Of course, smart meters should – and may in the future – do this for us but for the moment with a few small exceptions, penetration rates and privacy (or corporate monopolization ) issues around them prevent them from being nationally effective. It varies but in many States smart meters only represent around 5 or 10% of all meters and many although capable, aren’t configured to readily export data. It’s a bloody travesty.
The number of devices and support services hitting the market that will enable us to use existing smart devices to monitor and control energy is simply staggering (e.g. openenergy, meterplug, electricimp,steplight). I predict that they will be ubiquitously and cheaply available within this year and will offer a staggering variety of capability for our industry.
This has numerous ramifications but the most immediate one is the ability to capture energy demand profiles at a residential level at an affordable price. As export tariffs wane, accurately predicting demand versus generation profiles becomes increasingly important if accurate economic assessments are to be conducted for potential PV customers, but doing this cost effectively has not been possible. Until now.
As the energy audit customer said to the iPhone enabled solar designer: “Is that a revolution in your pocket or are you just glad to see me?”
Intelligent solar design
And what of the Commercial solar market? Once again, a huge focus in our report and several trends emerged. Firstly, it’s happening slower than we all hoped. 2012 data suggests that substantially less than 10% of the entire local market was Commercial although anecdotal evidence demonstrates that systems are increasingly being installed. In the right place, with the right client, at the right tariff, with the right distributor, the proposition has good sound legs; but it’s far from universal across our diverse energy market.
The Commercial PV market (despite is promise) is a bit like a new teenage girlfriend; unrealistically demanding, a little naïve, but so full of promise. And skulking in the background is the old man (electricity networks) wielding a very big and effective bat. He can effectively stop the whole fantasy at a whim and without consulting anyone, if he feels so inclined. At the moment, my intuition (and the data) suggests that the satisfaction we are getting is mostly from sneaking in the through the bedroom window at night, rather than a fully sanctioned relationship with the old man’s blessing….
Once again data and intelligent design become crucial in this space and some absolute revelations are bubbling to the surface, demonstrating just what our future PV markets will look like. Take for example the great pilot about to take place in Alice Springs under the watchful eyes of the Centre for Appropriate Technology and the NT’s Power and Water Corporation (not to mention similar projects going on with Australian Energy Market Operator and the Bureau of Meteorology).
For large Commercial PV to take off, project developers need to engage in energy markets and this includes the need for energy forecasting. Energy forecasting needs data and predictive analysis so networks know when and how to react to events, such as cloud cover.
The project in Alice Springs will install a set of high accuracy pyrometers around the township to monitor the impact and duration of cloud events with the aim being to understand the probability of statistically significant variation in output from PV. The findings will include such things as what is the ideal geographic dispersion of PV to minimise significant events on the network, potentially overcoming the issues previously mentioned around escalating residential penetration rates. If for example, certain sub stations or transformers would benefit, under a carefully controlled geographic dispersion of PV, then we could open up markets to much higher penetration rates that would otherwise be possible.
This also provides the foundation work for National, real time solar energy forecast modelling such as is already the case in some more advanced countries around the world (!). Within two years I expect we will be able to log on somewhere and watch cloud events travelling across our continent and PV energy flows increasing and decreasing in various network areas.
A great US study demonstrated that there is an important and definable correlation between geographic dispersion, system size and energy smoothing that has very real impacts on how we should be accounting for the costs and benefits of PV. Lawrence Berkeley National Laboratory researchers recently modelled the smoothing effect of distributed solar power, finding that “the relative aggregate variability of PV systems decreases with increased geographic diversity”. That study showed that “aggregate variability over a 15-minute period is one-sixth of the variability of a single PV system, and over a one-hour period, it is one third of the variability of a single PV system” .
The interrelationship and importance of this issue to the future market uptake is increasingly obvious. Right now, we are a pain the backside for distributors who are increasing barriers to uptake, particularly at large scale. However, as we mutually learn more about ideal dispersion and confidence levels around PV generation events, the floodgates for Commercial PV could be progressively opened up in an orderly fashion with huge benefits.
At the large scale multi MW end of the market, this kind of learning is essential, and will leap forward this year into a whole new world – in Australia at least. Take for example, some more modelling done by the Centre for Appropriate Technology at a 10MW site recently. A proposal for 1MW of PV to be deployed was analysed; minute by minute over an entire year and some advanced statistics and probability analysis conducted to provide some comfort for the utility around the risk of significant events. (Understandably, they just shudder at the prospect of 10% extra demand suddenly appearing because a cloud passes over an array)
The findings demonstrate what probability analysis can do for intelligent PV design. For example, in the cooler months when demand and the potential variation in solar output (hi’s and lo’s) were both lower, it could be statistically proven with a 99.5% confidence level that solar output would vary by a maximum of +/-135kVa. Perhaps most interestingly, in the summer months when variation jumped to +/-270kVa at a 97% confidence level, capping PV output at certain times, on certain days, was found to deliver only 5% less annual energy but get back to a 99.5% confidence level. Brilliant, logical and statistically valid design.

This type of detailed information is crucial in large PV projects where penalties are one of the biggest issues that affect risk and economics. Logically of course, the data and energy management technologies previously mentioned also play a critical role – back to convergence again!
What’s it all mean?
Assuming Warwick and I are right with our forecasts this year, the PV market will contract and continue to evolve. Some markets will strengthen, others will weaken. The timing of these changes varies and we can already predict when some more future changes are likely. Tuning into these issues is vital for business success and survival.
Data, innovation and targeting opportunities carefully with highly efficient processes should be a key part of your strategic and tactical plans. I don’t think storage or large scale solar is quite there yet, but by gosh it’s close and we are likely to see some big steps forward this year.
As Aung San Suu Kyi said “Revolution simply means radical change”.
Compared to where Australia was with PV just a few short years ago we are undoubtedly in the midst of a revolution, getting to the next level is going to mean radical change in how we do PV.
Welcome to the revolution.
Nigel Morris is director of Solar Business Services. This article was first published on his blog and is reproduced with permission.