Just three years ago this month, the carbon dioxide monitoring station atop Hawaii’s Mauna Loa reached a significant milestone: the first measurement of CO2 concentrations that exceeded the benchmark of 400 parts per million (ppm). Now, they may never again dip below it.
As CO2 levels once again approach their annual apex, they have reached astonishing heights. Concentrations in recent weeks have edged close to 410 ppm, thanks in part to a push from an exceptionally strong El Niño.

But it is the emissions from human activities that are by far the main driver of the inexorable climb of CO2 concentrations in the atmosphere. That trend, in turn, is driving the steady rise of global temperatures, which have set record after record in recent months.
Those CO2 levels will soon begin to drop toward their annual minimum as spring triggers the collective inhale of trees and other plant life. But because of the remarkable heights reached this year, the fall minimum, unlike recent years, may not dip below the 400-ppm mark at Mauna Loa.
“I think we’re essentially over for good,” Ralph Keeling, the director of the Mauna Loa CO2 program at the Scripps Institution of Oceanography, said.
And before too long, that will be the case the world over.
Steady Rise
Atmospheric carbon dioxide levels are monitored at stations around the world, providing records of the mark humans are leaving on the planet. Keeling’s father, Charles Keeling, began the recordings at Mauna Loa in 1958, revealing not only the annual wiggles created by the seasonal growth and death of vegetation, but the steady rise in CO2 from year to year.
The resulting graph, dubbed the Keeling Curve in his honor, became an icon of climate science.

Back then, CO2 levels were around 315 ppm (already an increase from preindustrial levels of about 280 ppm), but they have grown steadily, first crossing the 400 ppm threshold in May 2013. The following year saw the first monthwith an average over that level. Last year, it was three months.
But in each of those years, concentrations dipped back below that level in the fall, but for a shorter and shorter length of time.
While the world’s plants need CO2 to function, they can only soak up so much, leaving behind an excess every year — an excess that slowly lifts both the annual maximum and minimum, just as a rising tide lifts all ships.
That yearly excess (recently about 2 ppm) traps ever more heat in the Earth’s atmosphere, which has raised global temperatures by 1.6°F (0.9°C) since the beginning of the 20th century. In recent months, those temperatures haveneared 1.5°C (2.7°F) above those of the late 19th century — a milestone international negotiators are working to potentially avoid. Depending on how much emissions are reduced in the coming decades, the Earth could see another 3°F to 9°F (1.7°C to 5°C) of warming by the end of the century.
El Niño’s Boost
Last year, CO2 hit a weekly peak of about 404 ppm. If the trend had continued as normal, it likely would have been another couple years before year-round levels at Mauna Loa permanently rose above 400 ppm. But then came one of the strongest El Niños on record.
El Niño tends to lead to drought in the tropical regions of the planet, which can mean more wildfires and higher CO2 emissions. This El Niño helped cause a huge leap in CO2 levels compared to last year; over 2015, CO2 concentrations grew by 3.05 ppm, the largest jump on record.
It also marked the fourth consecutive year with a growth rate higher than 2 ppm — another hallmark of global warming is that the annual growth rate of CO2 is accelerating. At the beginning of the Keeling Curve record, the growth rate was only about 0.75 ppm.
Currently, CO2 levels are about 4 ppm higher than this point last year, thanks in part to a particularly big jump in April. Keeling isn’t sure what the exact cause of that jump was, but said it was likely a high-CO2 air mass moving in from Southeast Asia.
Because of that jump, the highest weekly value recorded this year has been 408.6, in mid-April. Daily values reached even higher, closing in on 410 ppm.
Such April jumps are fairly typical, Keeling said, though May generally has a higher monthly average than April because it is more consistently high. (The peak in CO2 levels is also shifting earlier in May because of the longer growing season ushered in by higher global temperatures.)
Permanently Over 400 ppm?
As May turns to June, CO2 levels will come down from their fever pitch, and the question is: How low will they go? Will they dip below 400 ppm one more time, or are we now in an over-400 ppm world.
For his part, Keeling thinks the latter situation is the more likely.
“I think it’s pretty unlikely that Mauna Loa will dip below 400 ppm in the monthly or weekly” averages, he said. That is a sentiment he first expressed in a blog post back in October, when it was becoming clear how strong El Niño would be.
Pieter Tans, lead scientist of NOAA’s Global Greenhouse Gas Reference Network, was more circumspect, saying it depends on how long the current 4-ppm rise from last year lasts into the summer.
Mauna Loa isn’t the only spot poised to move permanently above 400 ppm, though. The Cape Grim station in remote northwestern Tasmania saw its first measurements above 400 ppm on May 10. Now that it has reached that level, it will not dip below again, the scientists who maintain the site told the Sydney Morning Herald.
This is particularly significant because Cape Grim had yet to reach that mark, in part because the Southern Hemisphere has a less pronounced seasonal cycle than the Northern Hemisphere because it has more landmass and plant life. The majority of carbon dioxide emissions also come from the Northern Hemisphere and take about a year to spread across the equator.

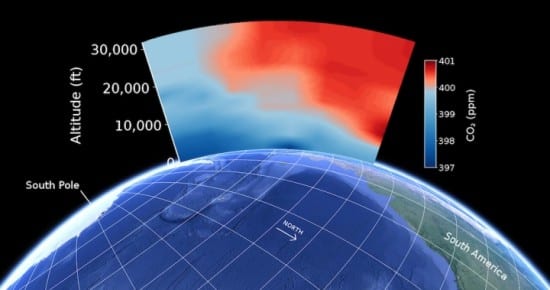
Keeling saw this process in action during an airborne mission run by the National Center for Atmospheric Research that measured CO2 levels throughout the depth of the Southern Hemisphere atmosphere in February. The measurements taken during that mission showed that even in some of the remotest reaches of the planet, near Antarctica, air masses had CO2 concentrations over 400 ppm. And those that didn’t were just barely under.
What this means is that “this is the last we’ll see of sub-400 ppm CO2 in the Southern Hemisphere, unless we’re able to someday achieve negative emissions,” NCAR scientist Britton Stephens, co-lead principal investigator for the mission, said in a statement.
Keeling suspects that the only places on the globe that may see levels dip below 400 ppm this summer will be at the highest latitudes (which have higher seasonal swings). They could perhaps do so again next summer, but then the planet as a whole will be above 400 ppm for the foreseeable future.
And while that benchmark is somewhat symbolic — the excess heat trapped by 400 ppm versus 399 is small — it serves as an important psychological milestone, Keeling said, a way to mark just how much humans have emitted into the atmosphere.
And with levels this year already nearing 410 ppm, “you realize how fast this is all going,” he said.
Keeling is hopeful, though, that with the signing of the Paris agreement and signs of action to limit emissions by various national governments, the iconic rise of the Keeling Curve will start to plateau.
“If Paris is successful, this curve will look very different in a matter of five or 10 years because it will start to change,” he said “And I hope we see that.”
Editor’s note: This story was updated to reflect the confirmation that the Cape Grim CO2 station had made its first measurement over 400 ppm.
This article was originally published on Climate Central. Re-produced with permission.