The apparent antipathy of the new Australian government towards renewable energy, and its attachment to the centralised generation model, is betrayed in an unusual document on electricity prices published recently.
The “Facts on Electricity Prices” document, posted by the Department of Resources and Energy (now part of the Industry portfolio), purports to explain to consumers the reason for recent electricity price rises, and what they, and the government, can do about it.
That’s a fair enough proposition. But it is the unusual language, selective information and outdated data that raises suspicion that this document serves another purpose.
The document goes through a range of different issues – from the carbon price, to the impact of various green schemes; and the big daddy of them all – network charges.
But it’s interesting to see what constitutes a “significant” impact, and what doesn’t. For instance, the document notes energy efficiency schemes make up around 3 per cent of household electricity prices “…and are not expected to significantly impact prices in most jurisdictions.”
But renewable energy – which also contributes 3 per cent to costs – is considered significant. So much so, that the government says it will review the scheme “as part of its commitment to minimise costs for households and business.”
That is yet another bad sign for renewables – even though the Climate Change Authority found last year that neutering the RET would have very little impact on prices, the Abbott government is seemingly determined to achieve a different outcome – which is why the CCA won’t be doing the next review.
The document rightly sheets home the blame for most of the electricity price rises on network costs, but how it spins that tale is a different matter.
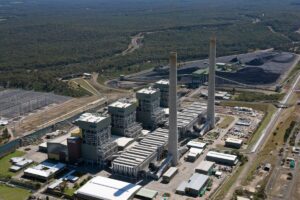
“This is largely because Australia’s electricity networks – the power poles and wires that deliver electricity to homes and businesses – were built 40 to 50 years ago and need replacing. This is an expensive task,” the document says. “At the same time we all have more appliances, from air conditioners to laptops and flat screen TVs, putting more demand on the electricity system.”
Well, it’s true that we have more appliances, but it’s not true that we use more electricity. Just yesterday, as we reported, the Australian Bureau of Statistics reported that average household consumption had fallen 23 per cent in the last decade. Even taking into the considerable population growth, aggregate residential demand had fallen 9 per cent.
It’s certainly true that the network operators used things like the increased use of air conditioning as justification for the $45 billion they were allowed to spend over the last 5 year regulatory period. It has been noted that every $1,500 spent on an air-con system has caused $7,500 in added network costs.
Was that investment needed? Many an expert, and much of the evidence, says not. But this government document curiously uses a graph from 2006/07 to justify the need to invest in more network infrastructure. In the electricity market, this is ancient history. Notably, it’s a graph that came from the Energex application to the Australian Energy Regulator which helped lead to that massive investment.
 What might have been more useful, and certainly more contemporary, would be this 2013 graph from the AER that shows what has happened to peak demand over the past few years.

Or they could have used this one below – also from the AER – which tells a similar story, but in various seasons. Perhaps the caption could have been: Oops, we super-sized the grid, and the consumers are paying for it.

That would have told a story about misplaced spending. If the federal government really wants to do something about electricity prices, that is what it needs to address. That would require it to take on the (conservative) state governments, who in most states own those assets and pocket a handy dividend from the profits they generate.
Snipping at the edges on green and climate programs – for the sake of ideology – won’t achieve much, apart from a little political gratification. This document looks like one straight out of central control, and the centralised business model.
P.S. Some people sent me emails recently wondering where the Energy White Paper had gone. We searched and couldn’t find it either. So we enquired and we are now happy to report that it can be found at http://www.ret.gov.au/energy/Documents/ewp/2012/Energy_%20White_Paper_2012.pdf