These new graphs show some new light on the falling costs of solar technology – both at utility-scale and on rooftops, and show how much further they may fall in coming years.
They were released this weekend by the International Renewable Energy Agency, which held its annual conference in its home base of Abu Dhabi this week.
IRENA hopes that the message that renewable energy technologies are below the cost of fossil fuels in many parts of the world might be finally starting to get through to governments. It has to, it says, if the governments are going to be making sensible decisions about the future.
“Any remaining perceptions that renewable power generation technologies are expensive or uncompetitive are at best outdated, and at worst a dangerous fallacy,” Adnan Z. Amin, the director-general of IRENA.
“Renewable energy projects across the globe are now matching or outperforming fossil fuels, particularly when accounting for externalities like local pollution, environmental damage and ill health.
“The game has changed; the plummeting price of renewables is creating a historic opportunity to build a clean, sustainable energy system and avert catastrophic climate change in an affordable way.”
The report, Renewable Power Generation Costs in 2014, concludes that biomass, hydropower, geothermal and onshore wind are all competitive with or cheaper than coal, oil and gas-fired power stations, even without financial support and despite falling oil prices.
It says, however, that solar photovoltaic (PV) is leading the cost decline, with solar PV module costs falling 75 per cent since the end of 2009 and the cost of electricity from utility-scale solar PV falling 50 per cent since 2010.

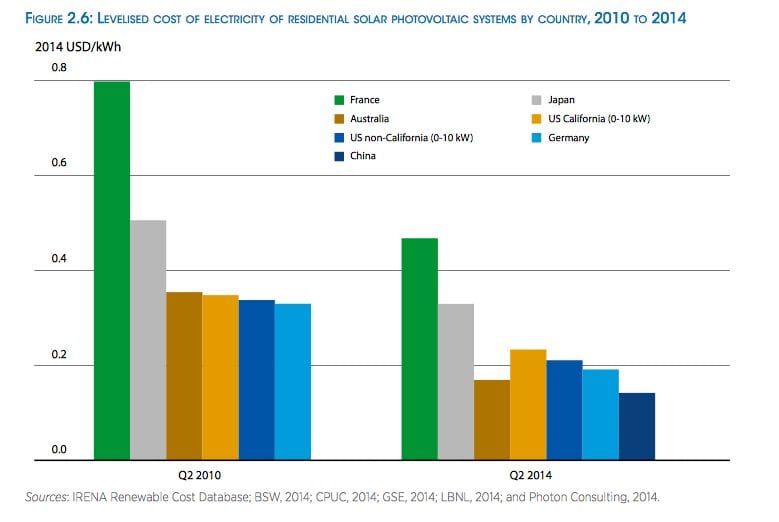
The second graph shows the declining cost of residential solar PV in various countries, including France Germany and Australia, in just the last four years. In most of these countries, the cost of residential solar is well below the grid price of electricity, heralding a revolution in the way the world produces electricity. (See our NRG story today).

And the third graph shows where these technology costs might fall within the next decade. The greatest potential, as in recent years, is in solar – not just solar PV, but also solar thermal, particularly with solar towers and storage.

Solar, as the above graph shows, will be increasingly cost competitive with fossil fuels in coming years, and many other technologies already are.
The average cost of wind energy ranges from $0.06/kWh in China and Asia to $US0.09/kWh in Africa. North America also has competitive wind projects, with an average cost of $US0.07/kWh, and some as low as $UD0.04/kWh.
IRENA says renewables are competitive, even when integrating high shares of variable renewables into the electricity. And When damage to human health from fossil fuels in power generation is considered in economic terms, along with the cost of CO2 emissions, the price of fossil fuel-fired power generation rises to between $US0.07/kwh and $US0.19/kWh.
“For 1.3 billion people worldwide without electricity, renewables are the cheapest source of energy.” And certainly not coal, as Australian Trade Minister Andrew Robb and Prime Minister Tony Abbott continue to argue in trying to justify and cheer-lead the development of massive coal mines in the Galilee Basin.
Giles Parkinson is in Abu Dhabi for the World Energy Future Conference as a guest of Masdar.