Last month’s CEDEX® Electricity Update reported a temporary cessation of the month by month increase in annualised emissions from NEM electricity generation, seen since last July.
In February, the increase resumed, but only slightly (Figure 5). On the supply side, the trends noted in last month’s Update continued: brown coal up slightly, gas and hydro down slightly, black coal and wind virtually unchanged (Figure 6).
Total demand for NEM electricity continued to fall, though only slightly on this occasion. State by state changes in demand (Figure 7) also continue the trend of the previous month. A further fall in Victoria, as the effect of the Point Henry smelter closure continues to work through the annualised numbers, was almost exactly offset by a large new load or loads in Queensland. There was little change in the other three NEM states.

The demand trend in WA is perhaps of more interest. February was the fifth successive month to show a fall in annualised demand. Unlike the NEM, there was no dip in electricity demand at the height of the financial crisis in 2009. Is electricity demand in WA finally coming to resemble the rest of Australia?

At the end of February each year the Clean Energy Regulator releases public data from the National Greenhouse and Energy Reporting Scheme (NGERS) for the previous financial year. Amendments made by the previous government to the original establishing legislation required detailed public reporting of generation and emissions at individual power stations, starting with data for 2012‐13. Data for 2013‐14 was release on 27 February. Some interesting points which can be extracted from the data include the following:
• The ten largest emitting power stations in 2013‐14:

Note that as‐generated emissions intensity includes electricity used by the power station itself, which can be up to 6 % or even more of generation. It is generally higher for brown coal than for black coal power stations, making their emissions performance on the basis of sent out electricity, relative to black coal, even worse than it appears in these figures.
- The emissions intensity of all of the power stations shown here, as well as the smaller emitters, changed from 2012‐13 to 2013‐14. Loy Yang A, Hazelwood, Bayswater, Yallourn, Loy Yang B and Mount Piper all reduced (improved) their intensity, while Eraring, Stanwell, Liddell and Gladstone all increased.
- Amongst the black coal power stations in the NEM, Kogan Creek in Queensland (0.81 t CO2‐e/MWh) has the lowest as‐generated emissions intensity, and is also the newest, while Gladstone, also in Queensland and one of the oldest, has the highest emissions intensity (0.96 t CO2‐e/MWh).
- In the NEM, small generators embedded in distribution networks, and not included in AEMO daily data, contributed an additional 7.2 TWh of generation in 2013‐14, at an average emissions intensity of 0.39 t CO2‐ e/MWh. This generation contributes to total electricity demand by consumers supplied through the NEM, but is not included in either the generation or the demand figures reported each month in CEDEX® Electricity Update.
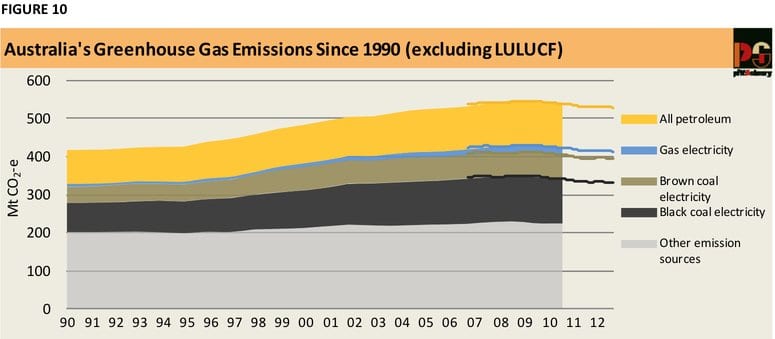
- Major generators supplying the South West Interconnected System (the main grid in WA) emitted about 13.5 Mt CO2‐e, at an average emissions intensity of 0.76 t CO2‐e/MWh.About pitt&sherry’s carbon emissions index CEDEX®The Energy Sector is the largest source of Australia’s greenhouse gas emissions. The energy use covered by the CEDEX® accounts for about 80% of Australia’s total energy combustion emissions, and 54% of total emissions (excluding land use change and forestry), as reported in the National Greenhouse Gas Inventory. Figure 10 below illustrates the growth in energy sector emissions, with the lines at the right showing the period and emission sources covered in the CEDEX®.

Data sourced from Department of Climate Change and Energy Efficiency and CEDEX®.
Increases in energy combustion have caused more than 90% of the increase in total emissions since 1990. Trends in energy emissions are a reliable indicator of Australia’s ability to achieve emissions mitigation and hold the key to reducing emissions as a whole.