In the year to August 2015, demand in the National Electricity Market again increased, this time to a level 0.8% above the minimum level that occurred in the year to February 2015.
The main source of increase continues to be electricity used in Queensland by the coal seam gas extraction industry. Significantly, however, it is now one year on from the closure of the Point Henry aluminium smelter in Victoria and the first indications of an underlying increase in demand in Victoria are emerging in the annualised figures.
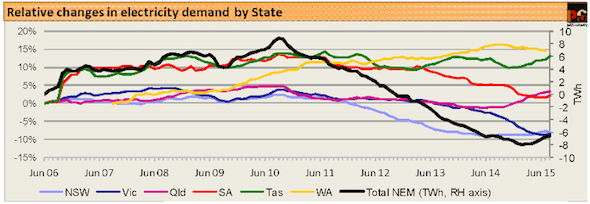
NSW was the only NEM state to record a decrease in annualised demand in August; and this may turn out to be a one-off blip. Only in WA is demand for electricity showing a persistent, though very gradual decline.


Total demand in the SWIS (the WA market) in the year to July 2015 was 1.5% lower than the maximum level reached eleven months previously, in the year to August 2014.
Turning to generation, it is significant that the data for the year ending August 2015 cover the first full 12 month period since the end of the carbon price and the associated cut back in hydro generation. It is therefore unsurprising, though nonetheless striking, that, while generation increased to meet growing demand, annualised emissions decreased for the first month since June 2014 (Figure 9).

The coal share of total generation was virtually unchanged from the previous month, with a very small decrease in the brown coal share and matching very small increase in the black coal share (Figure 10). Annual hydro generation increased slightly, also for the first time since June 2015.

Gas generation went down again with the largest fall again in Queensland, and falls also in Victoria and SA, but a small increase in NSW. In Queensland, reduced gas generation was offset by a small increase in coal generation and a large reduction in net exports to NSW. In Victoria and SA, reduced gas generation was mainly offset by the higher wind generation. In the broad then, the modest drop in emissions was a result of gas being replaced by wind and hydro, a process which of course contributed to the slight emissions reduction.
We conclude this issue with two graphs which we normally publish twice a year, to emphasise the difference between seasonal peak system demand (MW) and seasonal total energy consumption (TWh). For this purpose, winter is defined as the four months from May to August, and summer as the four months from December to March.
Historically, energy consumption has always been lower in the other four months – September, October, November and April – than in any of the other eight, which is the reason for the selections. Figure 10 shows winter total energy consumption in every mainland state except WA, for which complete data for August are not yet available.
In every state except Queensland (and SA very occasionally) winter consumption is higher than summer, implying that more electrical energy is used for heating than for cooling. Moreover, higher winter demand is generally correlated with colder winter conditions.
Figure 11 indicates that winter demand was the highest for several years in Queensland, NSW, SA and, after adjusting for the effect of the Point Henry smelter closure, Victoria. As explained previously, the Bureau of Meteorology data indicate that May and June were about average but July was colder than average. It is thus not yet possible to assess the extent to which the observed modest increases in electricity demand may have been caused by colder than average winter weather over the whole season.

Finally, Figure 12 shows the relationship between seasonal peak demand and seasonal energy consumption for the two states (other than Tasmania, where both peak demand and highest seasonal energy consumption are always in winter) which best characterise the differing relationships between peak demand, total energy and seasonal weather. In Victoria peaks are always in summer, associated with heatwaves, but winter energy consumption is consistently much higher than summer. In Queensland, both peak demand and total energy consumption are higher in summer than in winter.

Hugh Saddler is the energy analyst for Pitt&Sherry and writes the monthly Cedex report.


