How Germany may get 6-fold boost in wind power from fewer turbines

Renewables International

The recent IWES study on a 100 percent supply of renewable power implicitly expects Germany to increase the share of wind power from 15 percent fewer turbines, with overall power consumption remaining basically unchanged. What would that look like?

28574_original_R_by_kfm_pixelio.de
The German “Bierdeckel” literally means “beer lid” because it used to be placed on top of your beer glass back in the pre-refrigeration days when bars were filled with flies. These days, you only find “beer lids” under your beer as a coaster to protect the table from condensation. But German waiters also use them to write down how much you have drunk, and this tally even represents a legal contract by German law. And whenever Germans want a quick calculation, they speak of doing it on the proverbial Bierdeckel. For instance, a few years back one politician proposed a radical simplification of income taxation, with tax returns being possible on a Bierdeckel.

Common wisdom has it that, as the mayor of Tübingen, Boris Palmer, recently put it (see the English version from this climate-denial website), “We need to double the number of currently 25,000 wind turbines in order to supply Germany.” The IWES study came to a much different conclusion. Is it feasible?

Let’s do a quick back-of-the-envelope calculation – or, if you are German, you can put it on your Bierdeckel.

At the end of 2013, Germany had 23,645 wind turbines with a total installed capacity of around 33.7 GW. Let’s simplify the average to 1.5 MW per turbine.

That figure includes a lot of the old, smaller stuff, however. In the first half of 2014 (PDF), for instance, Germany installed 650 wind turbines with a total capacity of around 1.7 GW, nearly 3.0 MW per turbine – roughly twice the historic average.

The total for mid-2014 is therefore around 24,900 turbines with a total capacity of 35.4 GW, equivalent to 1.42 MW per turbine. This roughly 1.5 MW per turbine covered 10 percent of power supply in the first half 2014, with around 25,000 turbines standing.

 The scenario described in a series of posts last week has the number of turbines dropping to 21,349, a decrease of around 15 percent once the installations from 2014 are added (my estimate of ~10 percent decrease was based on the number at the end of 2013).

One obvious way of increasing power production would be to increase generator size sixfold. Unfortunately, this approach would require the average turbine size to grow to 9.0 MW, a size not yet even built as a prototype. Although the first model was built in 2007, Enercon’s 7.5 MW E126 still has the greatest capacity of any wind turbine ever built.

20140829
An E126 in Druiburg. What looks like bushes in the middle of the photo is actually a group of full-grown trees as tall as three-story buildings. When I asked the manager of this wind farm whether he would buy another 7.5 MW E126, he said he wasn’t sure. “I could also get three 2.5 MW units for the same capacity, and I would spread my risks across more units.”

The other option is to increase swept area by using longer rotor blades. This increase is then not measured in megawatts, but in a greater capacity factor. The study provides us with estimates of future capacity factors for both onshore and offshore wind, so we could back-calculate the average generator size in MW from the number of GWh from the MW installed. The study gives us an estimate for installed MW, just not in the background document we have focused on. Ladies and gentlemen, I present you with the 24-page summary (PDF in German).

We know that the current capacity factor for all wind turbines in Germany is no more than 20 percent. For onshore wind, that is expected to increase by 50 percent to 30 percent, while the CF of offshore is expected to continue at the current rate of 44 percent.

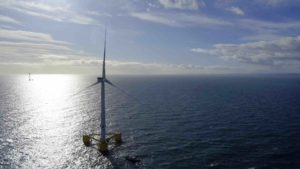
Nearly 4,000 of the 21,349 turbines in the scenario would be offshore, nearly a fifth. At present, the average offshore turbine

rsz_mw100percent

is roughly 20 percent bigger than the average onshore turbine newly installed. For instance, on Friday the 80th and last turbine was installed at the DanTysk wind farm in Germany, where 3.6 MW turbines are used. The turbines used at London Array have the same generator size.

Hence, a fifth of future turbines would produce more than twice as much power because of generator size and again more than twice as much power because of the greater capacity factor, but that is not quite as sixfold increase. The remainder would have to come from even greater generator sizes, which is not unlikely; 5MW may soon be the standard for offshore wind turbines. But the study assumes an average of 10 MW per offshore turbine, a size still only on the drawing board.

The situation looks different for onshore. Here, the capacity factor is assumed to be 50 percent greater in the future; a sixfold increase would be 500 percent greater with the same amount of installed MW. Generator capacity would therefore have to increase fourfold for a sixfold increase in MWh, putting the average onshore turbine size close to 6MW. The study assumes 5MW per onshore turbine.

As the example of the E126 shows, even bigger sizes are feasible onshore, so this finding is not impossible. Whether it is plausible or not is perhaps a matter of opinion. And the situation get even less plausible when we talk about storage — but let’s save that for tomorrow.

One question still remains, however. IWES’s interactive map states that a whopping 56,594 GWh of wind power would be “excess” in the scenario, which I assumed to mean lost because stored electricity as reported separately. If so, this 100 percent renewable power supply would lose as much wind power as Germany now generates.


Source: Renewables International. Reproduced with permission.

Comments

One response to “How Germany may get 6-fold boost in wind power from fewer turbines”

  1. Mark Roest Avatar
    Mark Roest

    Thank you for your article.
    There has been considerable replacement of early wind turbines with later, more advanced models in the United States. Besides increasing the electricity generated from a given physical area, this makes smaller machines available, at used prices, to other places for which they will be adequate to supply the local demand. This significantly reduces the total capital cost to society of the replacements.

    One question that must be considered in replacing blades and generators is whether the towers are designed, and in good enough condition, to take the greater loads on a constant basis, and whether they can tolerate increasing numbers of extreme storms. Breakthroughs in the cost, performance and longevity of towers could be valuable here, and they are definitely on the horizon.

    Based on what I have read about battery system prices in Germany, your statement that “the situation get even less plausible when we talk about storage” is plausible. This is only a temporary situation, however. For multiple reasons, including the Tesla gigafactories, battery cost will fall drastically within 2 to 5 years, to $200 U.S. per kWh capacity or less, bringing the levelized cost (amortized over system life) of storing a kWh of electricity to around 1 or 2 cents. That radically changes the equation.
    The next question is scale. I am not sure of your meanings in the last paragraph, so I made some guesses; thus my conclusions below are tentative. If “56,594 GWh of wind power would be “excess” in the scenario,” and if that refers to potentially generated electricity that is spilled by feathering the turbines or otherwise, and if that spillage occurs in a fairly consistent way over 200 days of the year, then approximately 300 GWh of battery storage would cover most of the momentary surplus.
    If battery cost is $200 U.S. per kWh capacity, the required storage would cost about $60 billion U.S.. If the base price for electricity in Germany is around 20 cents U.S. per kWh the market value of the stored electricity would be at least around $11 billion U.S. per year. That means the payback period on that investment, without counting finance charges, would be less than six years. I expect batteries of the mid-future to last 10 to 30 years.
    If you can find or develop any corrections to my guesses about the amount of electricity that needs to be stored, and when, as well as electricity costs, I would invite you to plug them into the logic above, or pass them along to me or other analysts to try to work them out.
    The largest weakness in the logic above is the variability of the amount to be stored, so the storage capacity will need to be optimized, both in terms of immediate economics, and in terms of the potential impacts for eliminating the last bits of fossil and nuclear fuel from the picture. I would greatly appreciate being able to see the day-by-day amount of electricity that needs to be stored.
    It would be awesome to have the results of a computer analysis that breaks storage requirements down to 15-minute intervals or less (because that approaches the usual fluctuations in wind energy available), and reports out a frequency distribution of various amounts of storage needed (analogous to a ‘wind rose’ graph of the frequency distribution of energy and direction) through the average year expected, looking forward.
    The absolute best thing would be to have the storage requirements correlated with:
    1. the potential wholesale and retail market value of that electricity at the rates in effect when it is used, so that the true economic value of the storage would be visible, and
    2. the fuel use and carbon releases that would be avoided when the saved electricity is delivered to the grid and to the self-users.

Get up to 3 quotes from pre-vetted solar (and battery) installers.