After enjoying a strong month in July – where wind accounted for half of the electricity demand in South Australia – the contribution of wind energy across the National Electricity Market slumped sharply in the month of August and wind speeds eased.
According to this graph from Green Energy Markets, the average capacity factor of wind farms in the NEM (which does not include WA, Northern Territory, Mt Isa) fell by nearly half to 25.7 per cent.

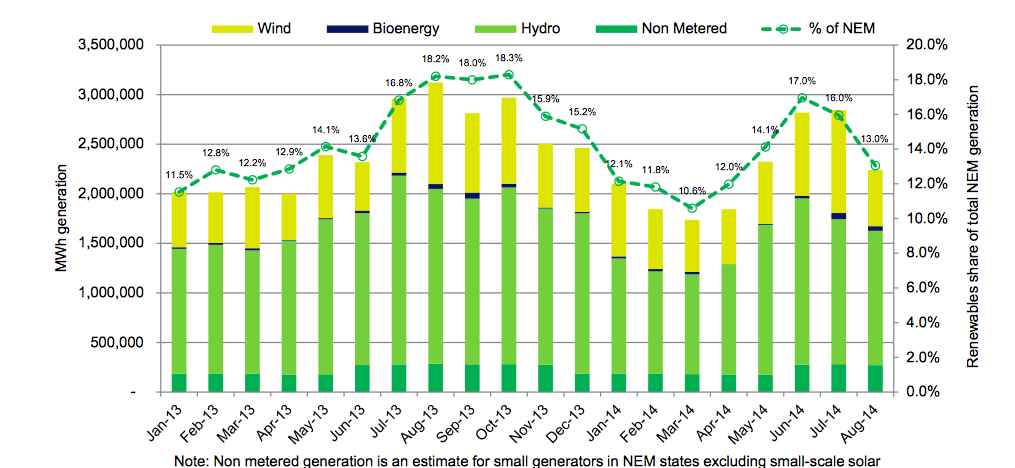
This second graph shows the total share of renewables in the NEM flu to 13 per cent in August, mostly due to that sharp reduction in wind output. Tat compare to a 2014 peak of 17 per cent in June and a peak last October of 18.3 per cent.

 But here is the most troubling table of all. It shows the number of new power stations accredited in 2014. A grand total of just 35MW, in a year in which the country should be installing well north of 1,000MW to meet its bipartisan renewable energy target.
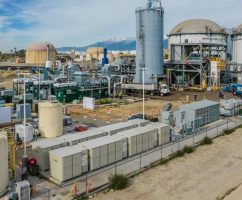
According to Green Energy Markets, just two small bioenergy power stations received accreditation this month. One is based in Cessnock, NSW and the second is in Brisbane, Queensland. In July, the only new power station to be accredited was a small run-of-river hydro plant in Tasmania.